import numpy as np
import pandas as pd
import matplotlib.pyplot as plt

# 3개의 2차원 점 설정
X = np.array([
    [-5.0, -3.0],  # 1번
    [-5.0, -5.0],  # 2번
    [-5.0, -4.0],  # 3번
])

def minmax_scale(points: np.ndarray) -> np.ndarray:
    """열(특징)별 Min-Max 정규화"""
    mins = points.min(axis=0)
    maxs = points.max(axis=0)
    denom = np.where(maxs - mins == 0, 1, maxs - mins)  # 0으로 나누기 방지
    return (points - mins) / denom

def standardize(points: np.ndarray) -> np.ndarray:
    """열(특징)별 표준화 (z-score)"""
    mean = points.mean(axis=0)
    std = points.std(axis=0)
    denom = np.where(std == 0, 1, std)  # 0으로 나누기 방지
    return (points - mean) / denom

datasets = {
    "unscaled": X,
    "minmax": minmax_scale(X),
    "standard": standardize(X),
}

print('벡터크기: 원점과 거리')
distances = pd.DataFrame({
    title: np.linalg.norm(data, axis=1)
    for title, data in datasets.items()
})
display(distances.T.assign(argmin=lambda df: np.argmin(df.values, axis=1)).round(2))
벡터크기: 원점과 거리
Loading...
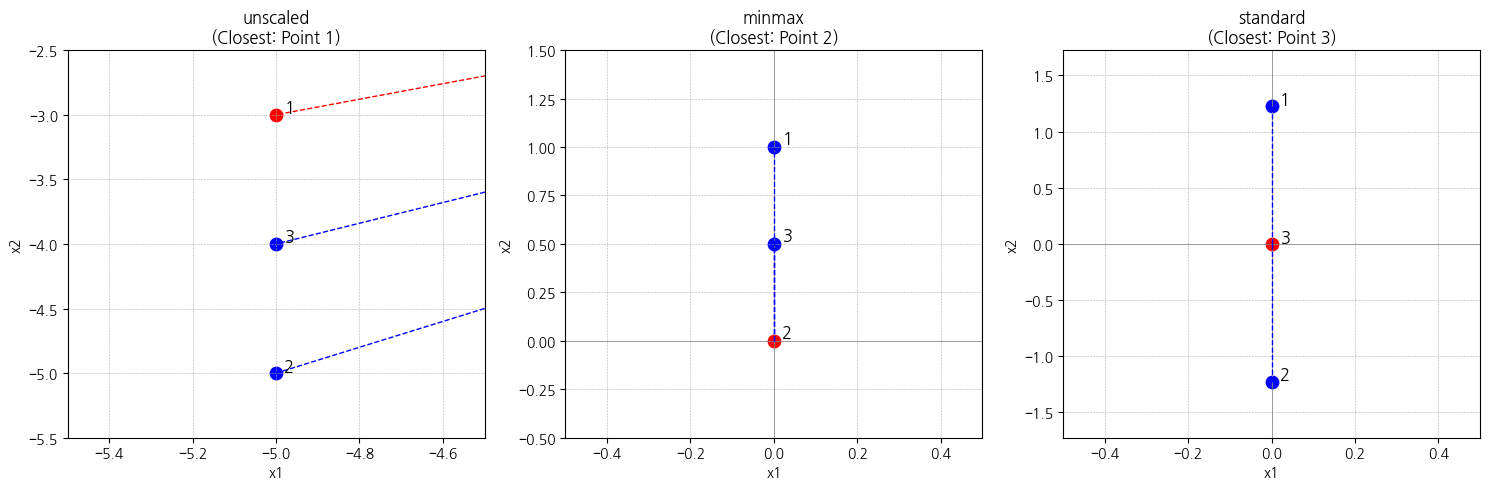
plt.figure(figsize=(15, 5))

for i, (title, 거리) in enumerate(distances.items(), 1):
    closest = np.argmin(거리)

    ax = plt.subplot(1, 3, i)
    ax.set_title(f"{title}\n(Closest: Point {closest+1})")
    ax.set_xlabel("x1"); ax.set_ylabel("x2")
    # 보조선
    ax.axhline(0, color="gray", linewidth=0.5)
    ax.axvline(0, color="gray", linewidth=0.5)
    ax.grid(True, linestyle="--", linewidth=0.4)

    # 전체 점 표시
    data = datasets[title]
    for idx, (x, y) in enumerate(data):
        color = "red" if idx == closest else "blue"
        ax.scatter(x, y, s=80, color=color)
        ax.text(x + 0.02, y + 0.02, f"{idx+1}", fontsize=12)

        # 원점과 거리선
        ax.plot([0, x], [0, y], color=color, linestyle="--", linewidth=1)

    # 축 범위 자동 설정 + 살짝 여유
    xmin, xmax = data[:, 0].min(), data[:, 0].max()
    ymin, ymax = data[:, 1].min(), data[:, 1].max()
    ax.set_xlim(xmin - 0.5, xmax + 0.5)
    ax.set_ylim(ymin - 0.5, ymax + 0.5)

plt.tight_layout()
plt.show()